Overview
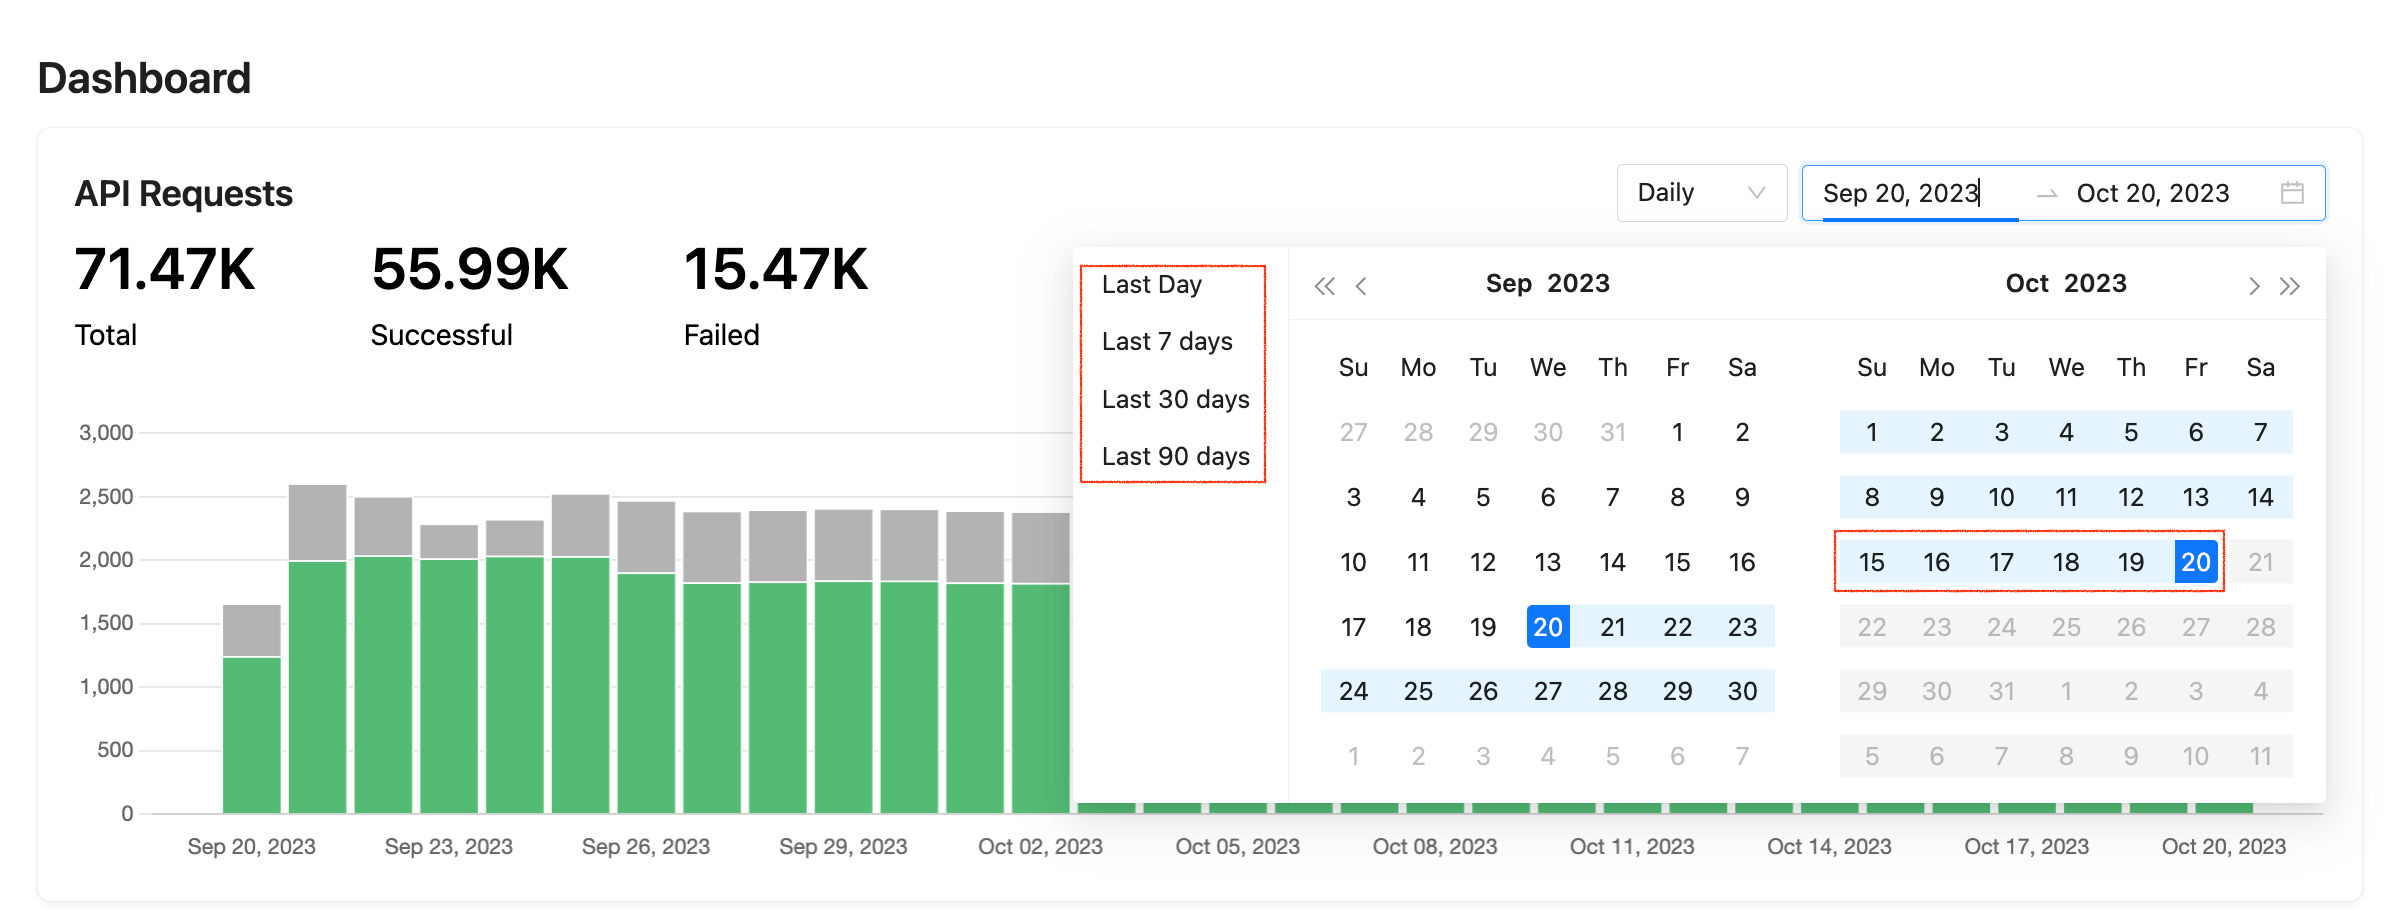
The Dashboard is the first page that loads for any project. It shows your project’s activity at a glance, including requests made to StackOne’s Unified API and webhooks. Use it to monitor the health and growth of your connectors. Once you start using various available StackOne connectors, the dashboard will populate the data respectively.Dashboard graph
You can configure multiple projects, and each will have its own dashboard statistics.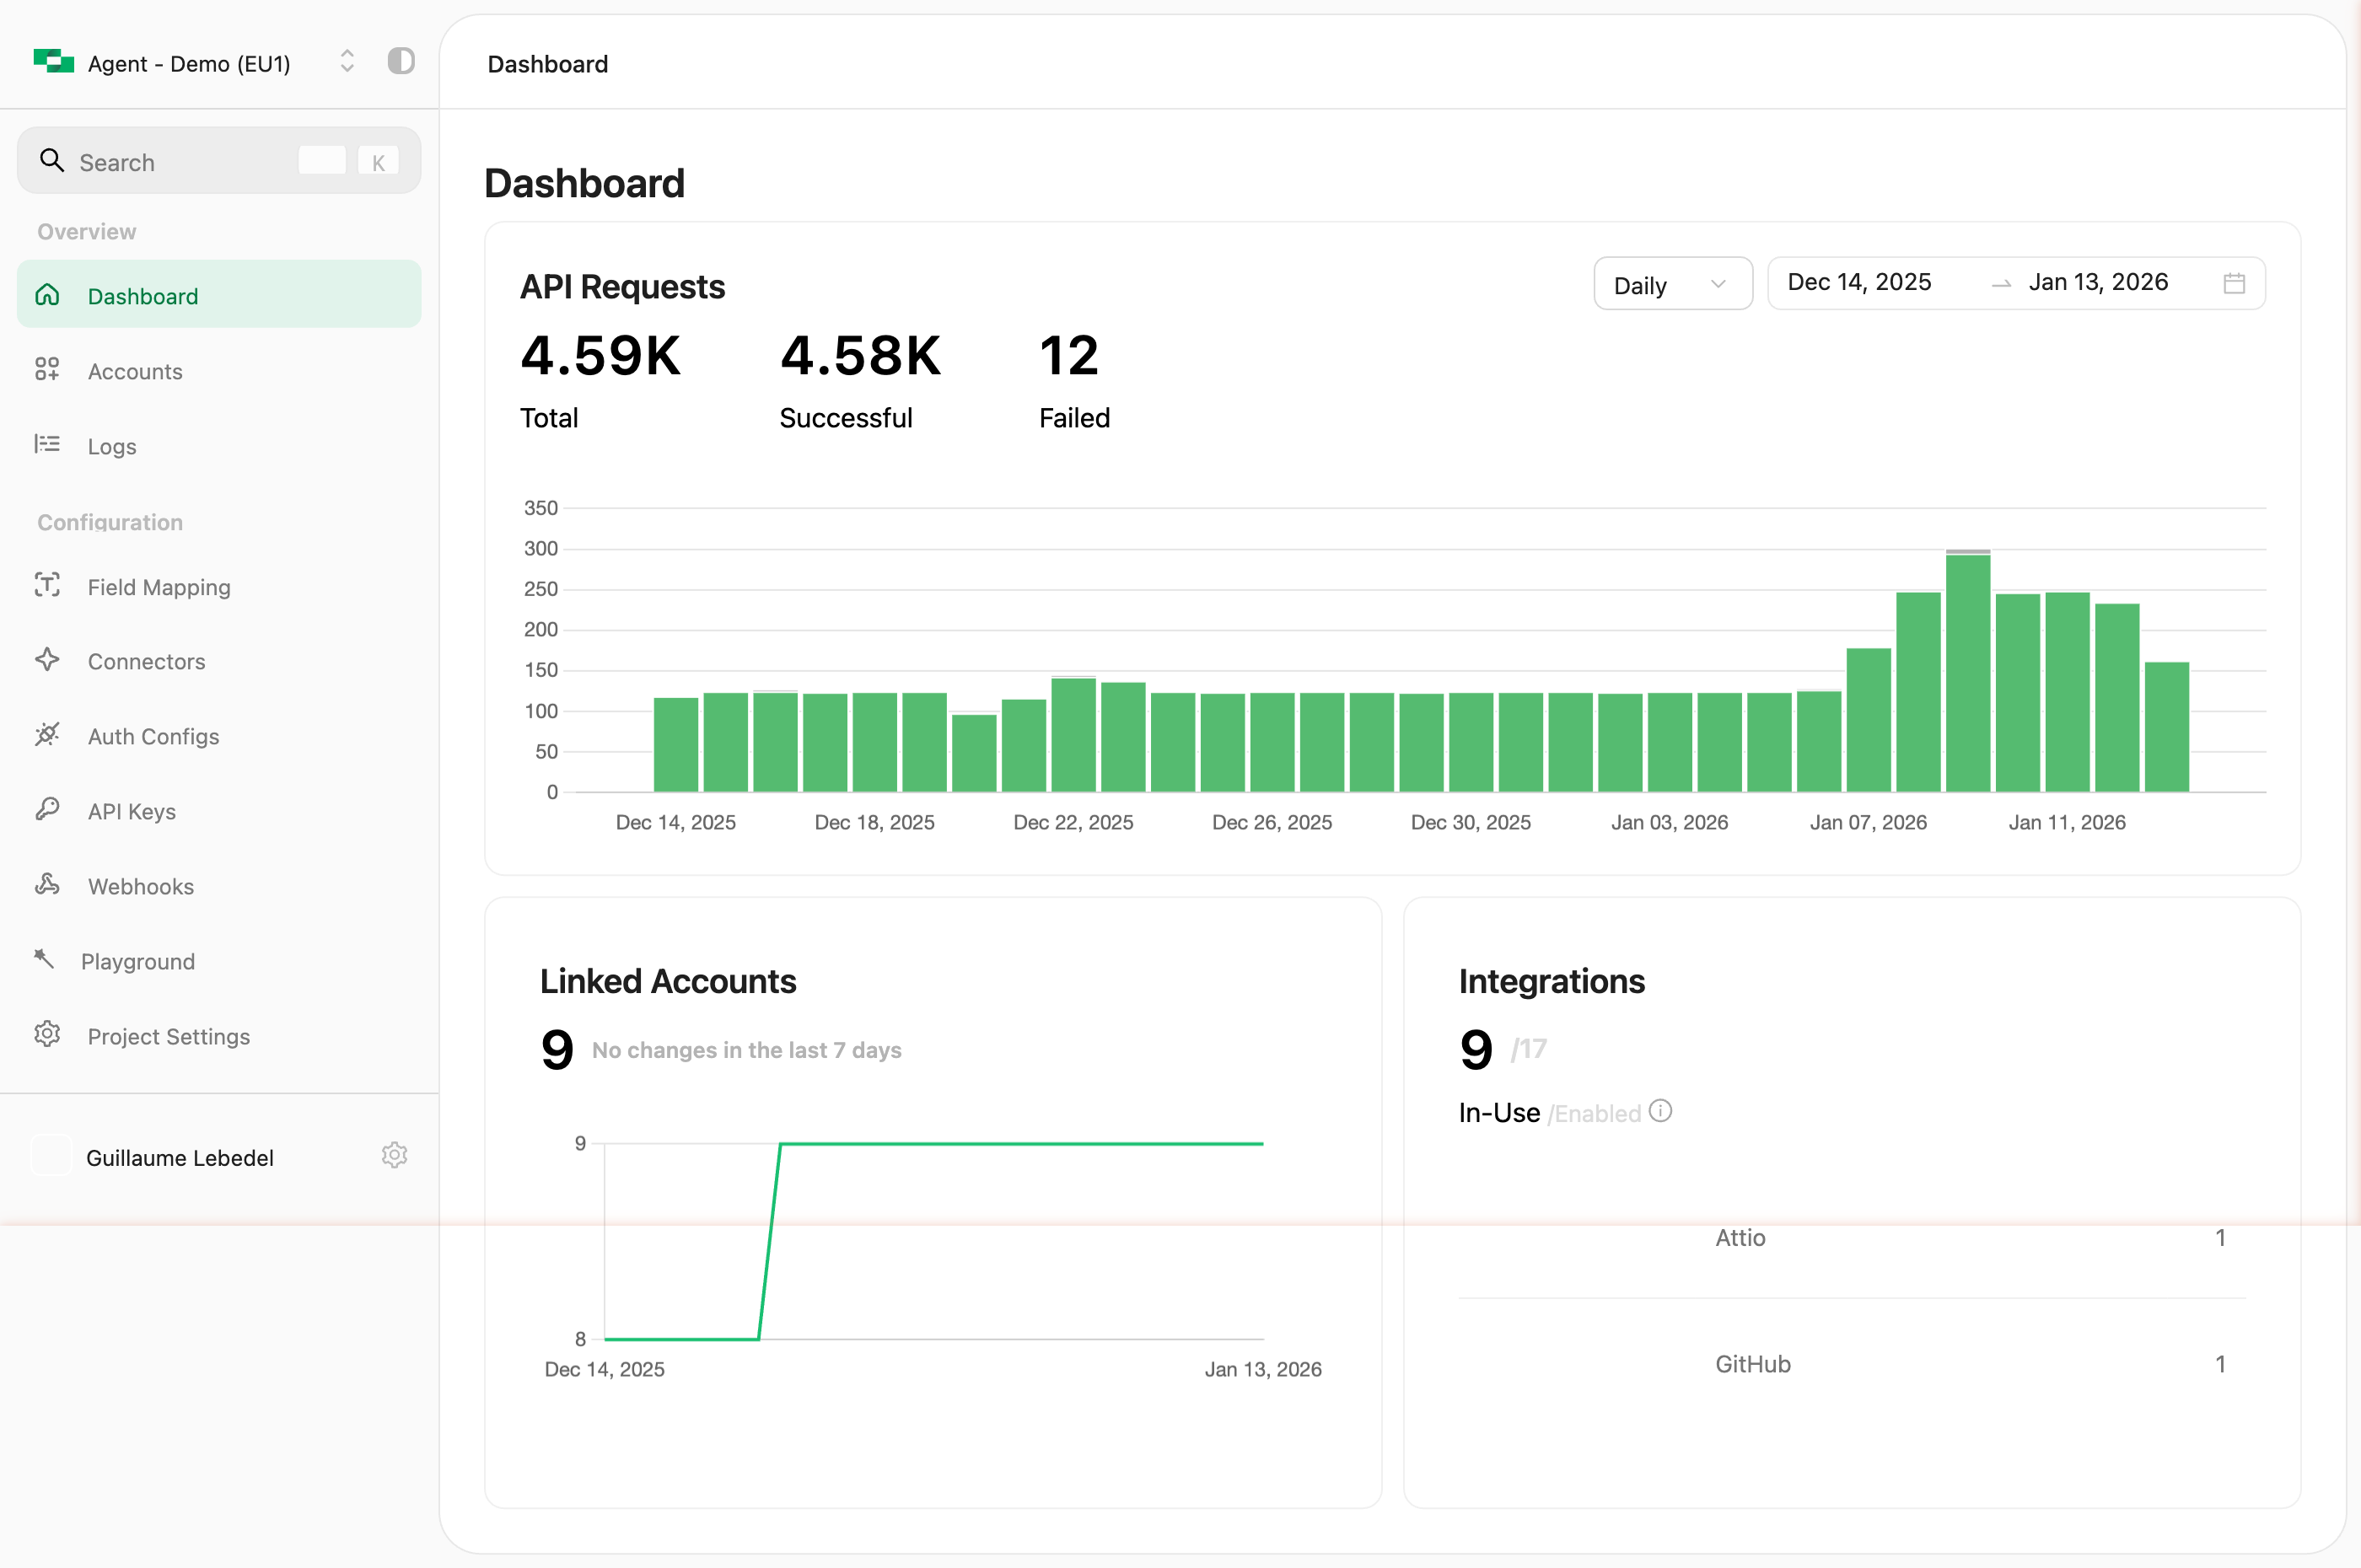
- 🟢 Successful count, HTTP response code 200 or 201 (200s)
- 🔴 Failed count, any request which returned an error status code (400s or 500s)
hourly, weekly or monthly data points.
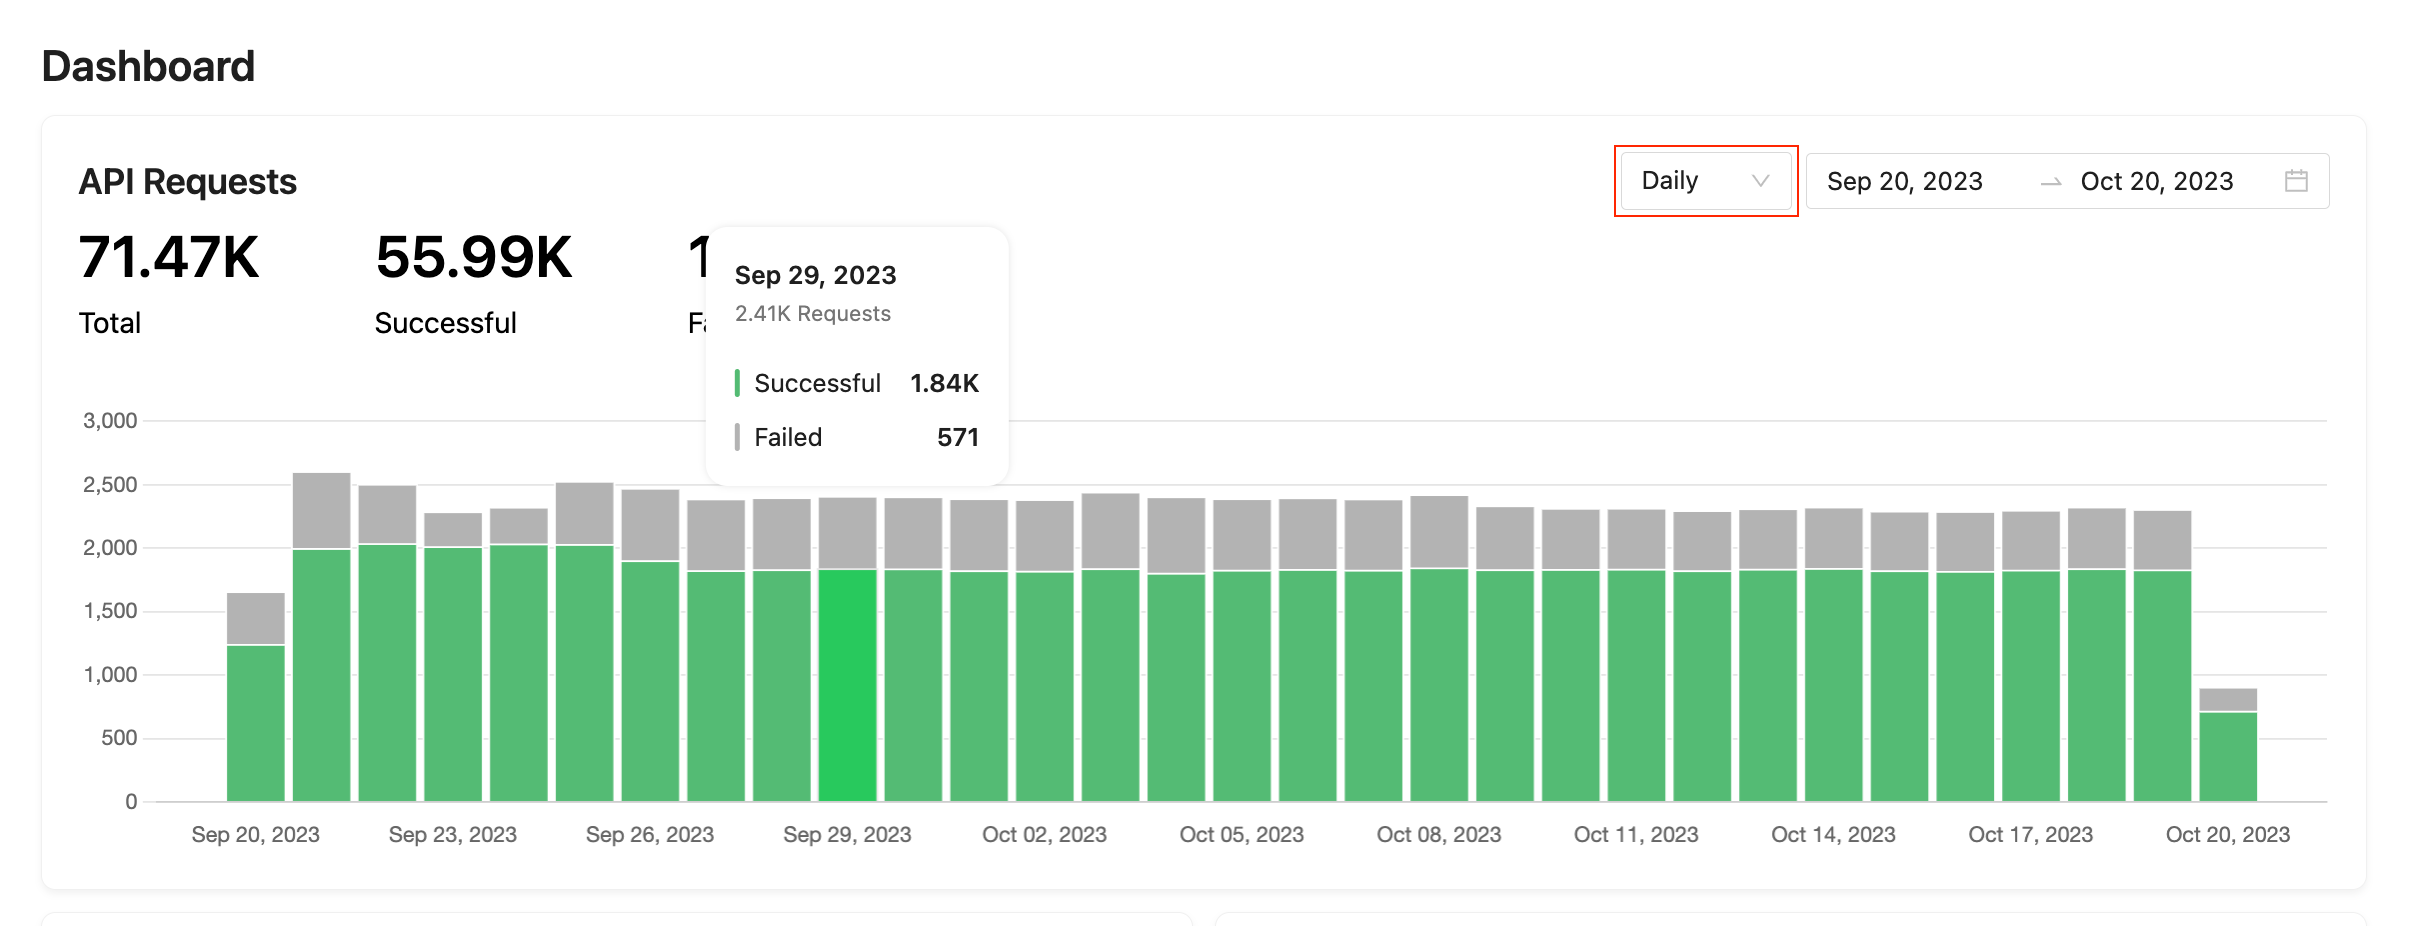
Additional InfoThe graph will count requests made to one of the supported unified API endpoint regardless of the source of the request as long as it was properly authenticated. This means requests made via Postman requests, the docs.stackone.com API Reference test UI, or any request made via the request tester in the accounts page will also be included within the graph.