Login

Dashboard overview

Overview

πŸŽ† Hooray! You've got access to the StackOne platform. The first thing you'll see is a Dashboard page, a place for viewing all API requests made to StackOne's Unified API. The main goal of the dashboard is to monitor the health and growth of your integrations.

Initially, you will see an empty list of API requests, Linked Accounts, and Integrations.

Initial StackOne Dashboard UI

Once you start using various available StackOne integrations, the dashboard will populate the data respectively.

Dashboard graph

You can configure multiple projects, and each will have its own dashboard statistics.
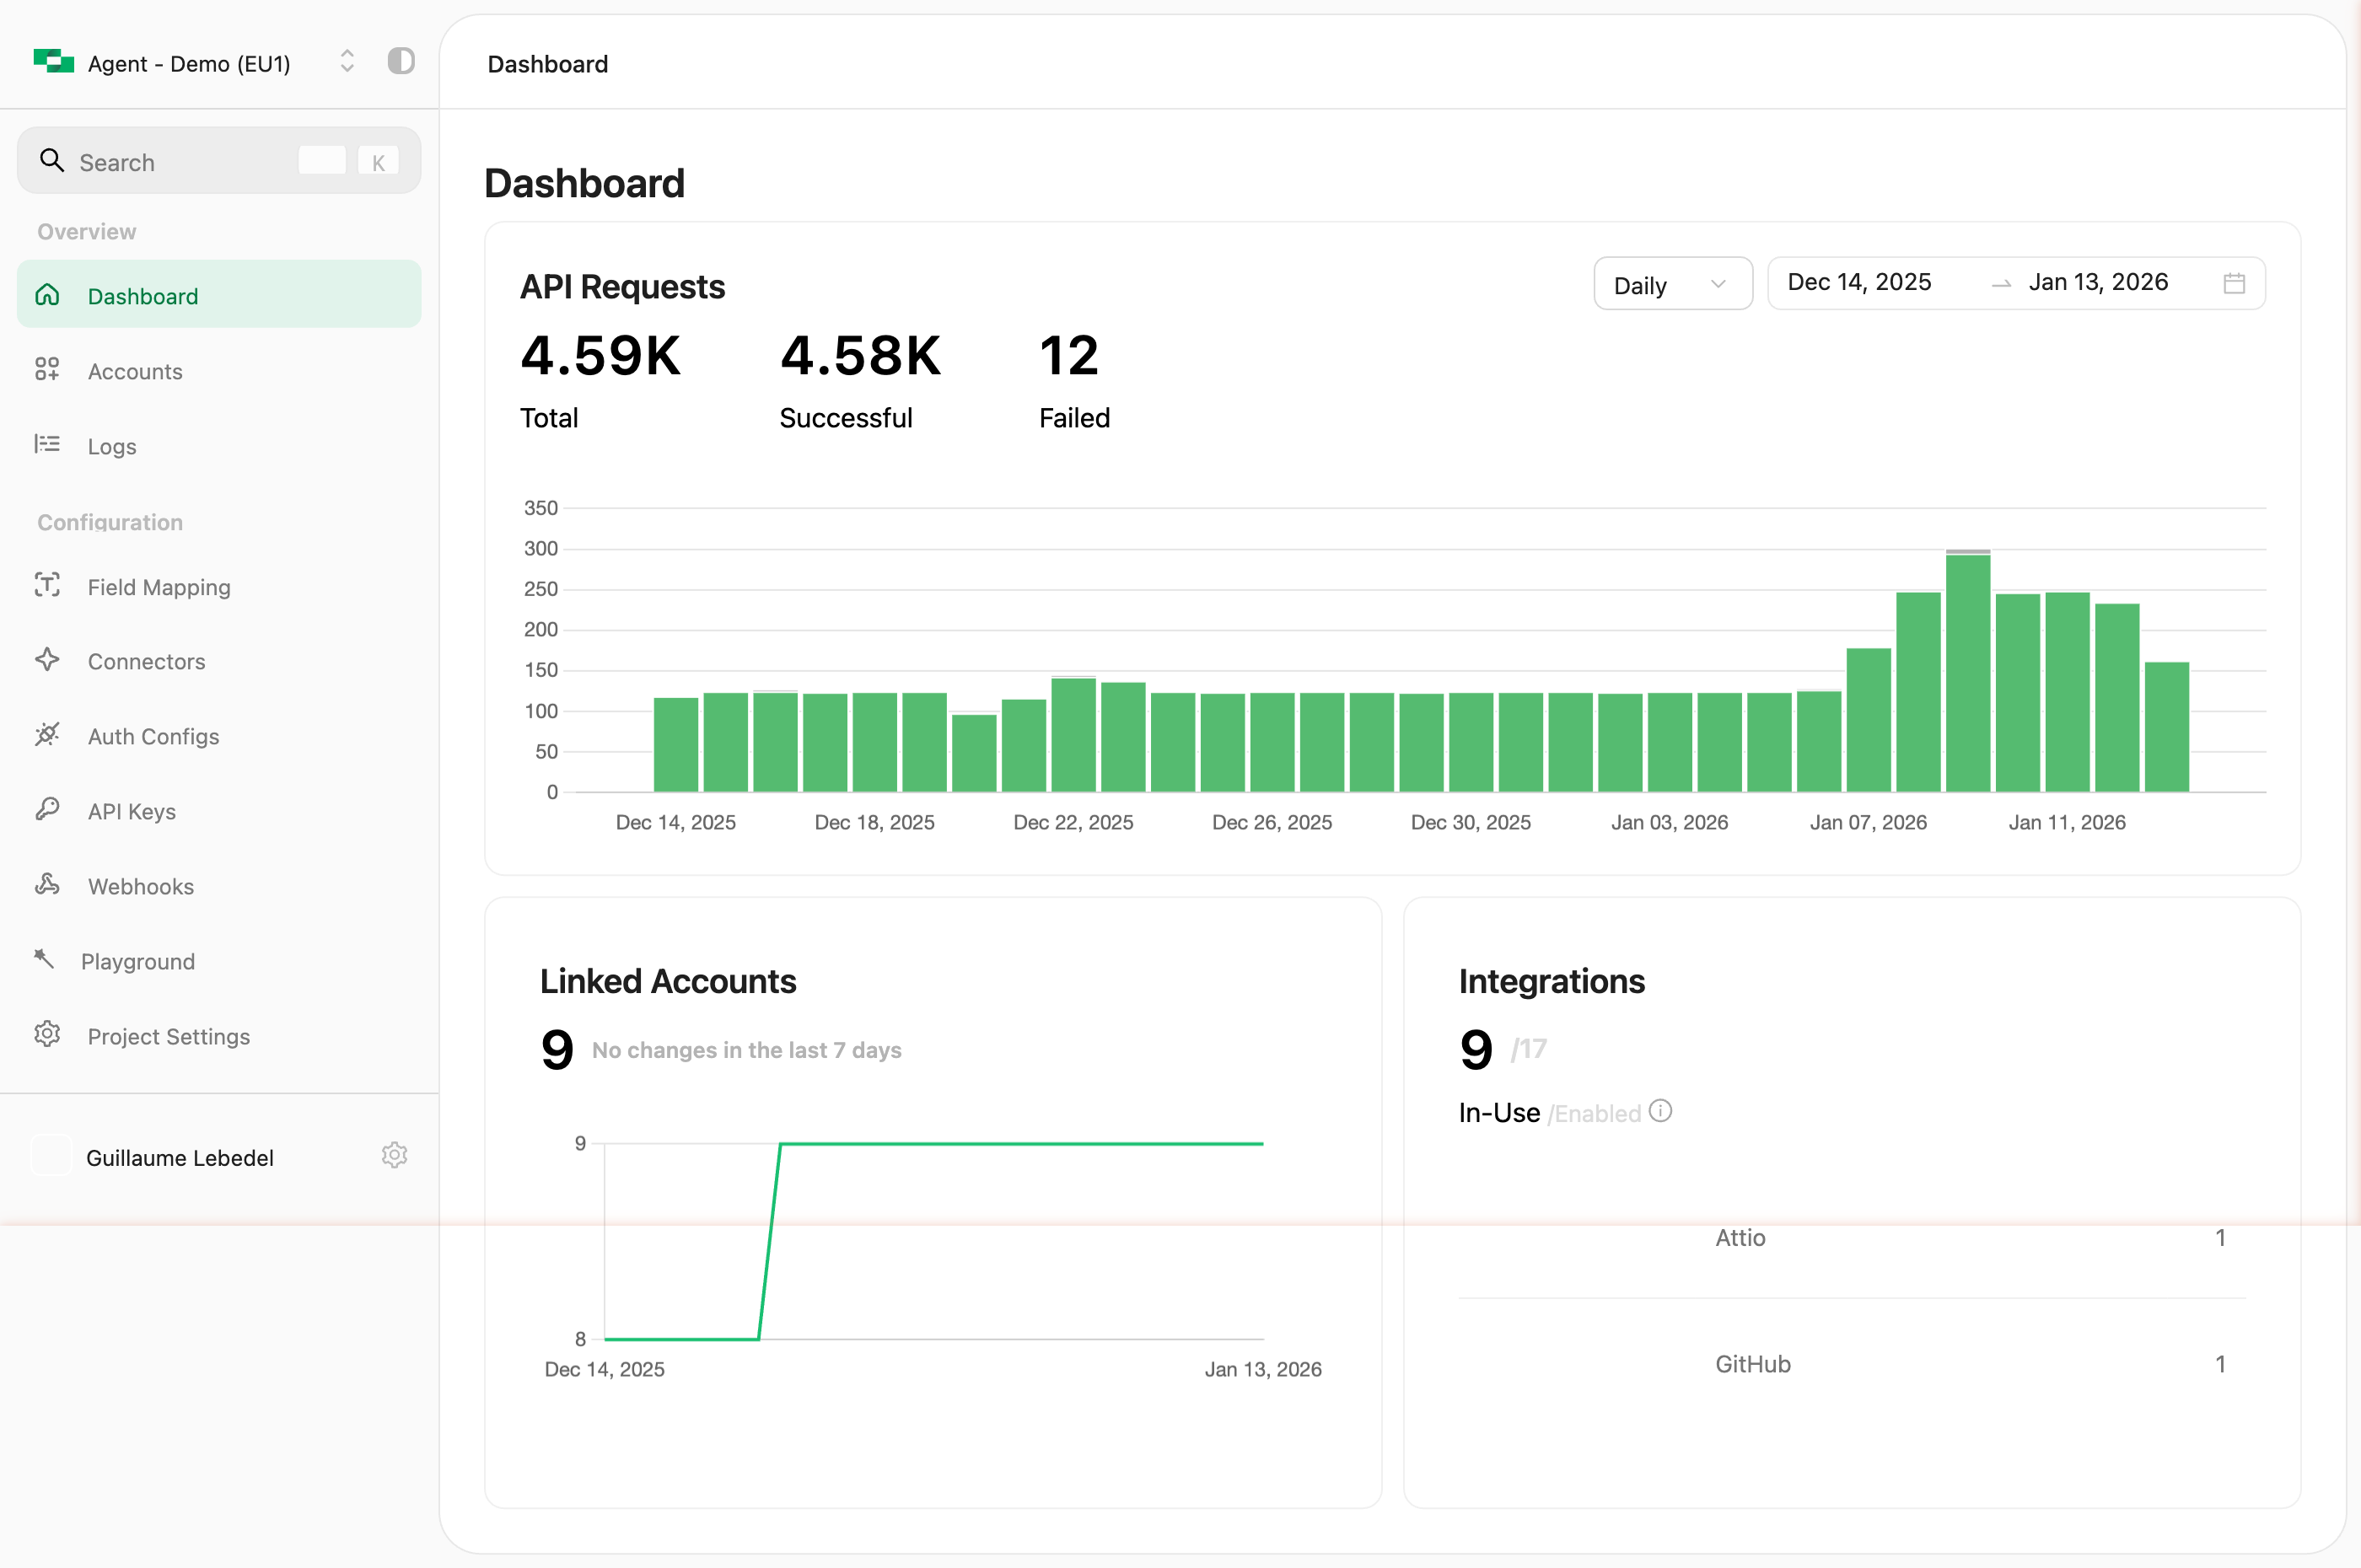
Dashboard data

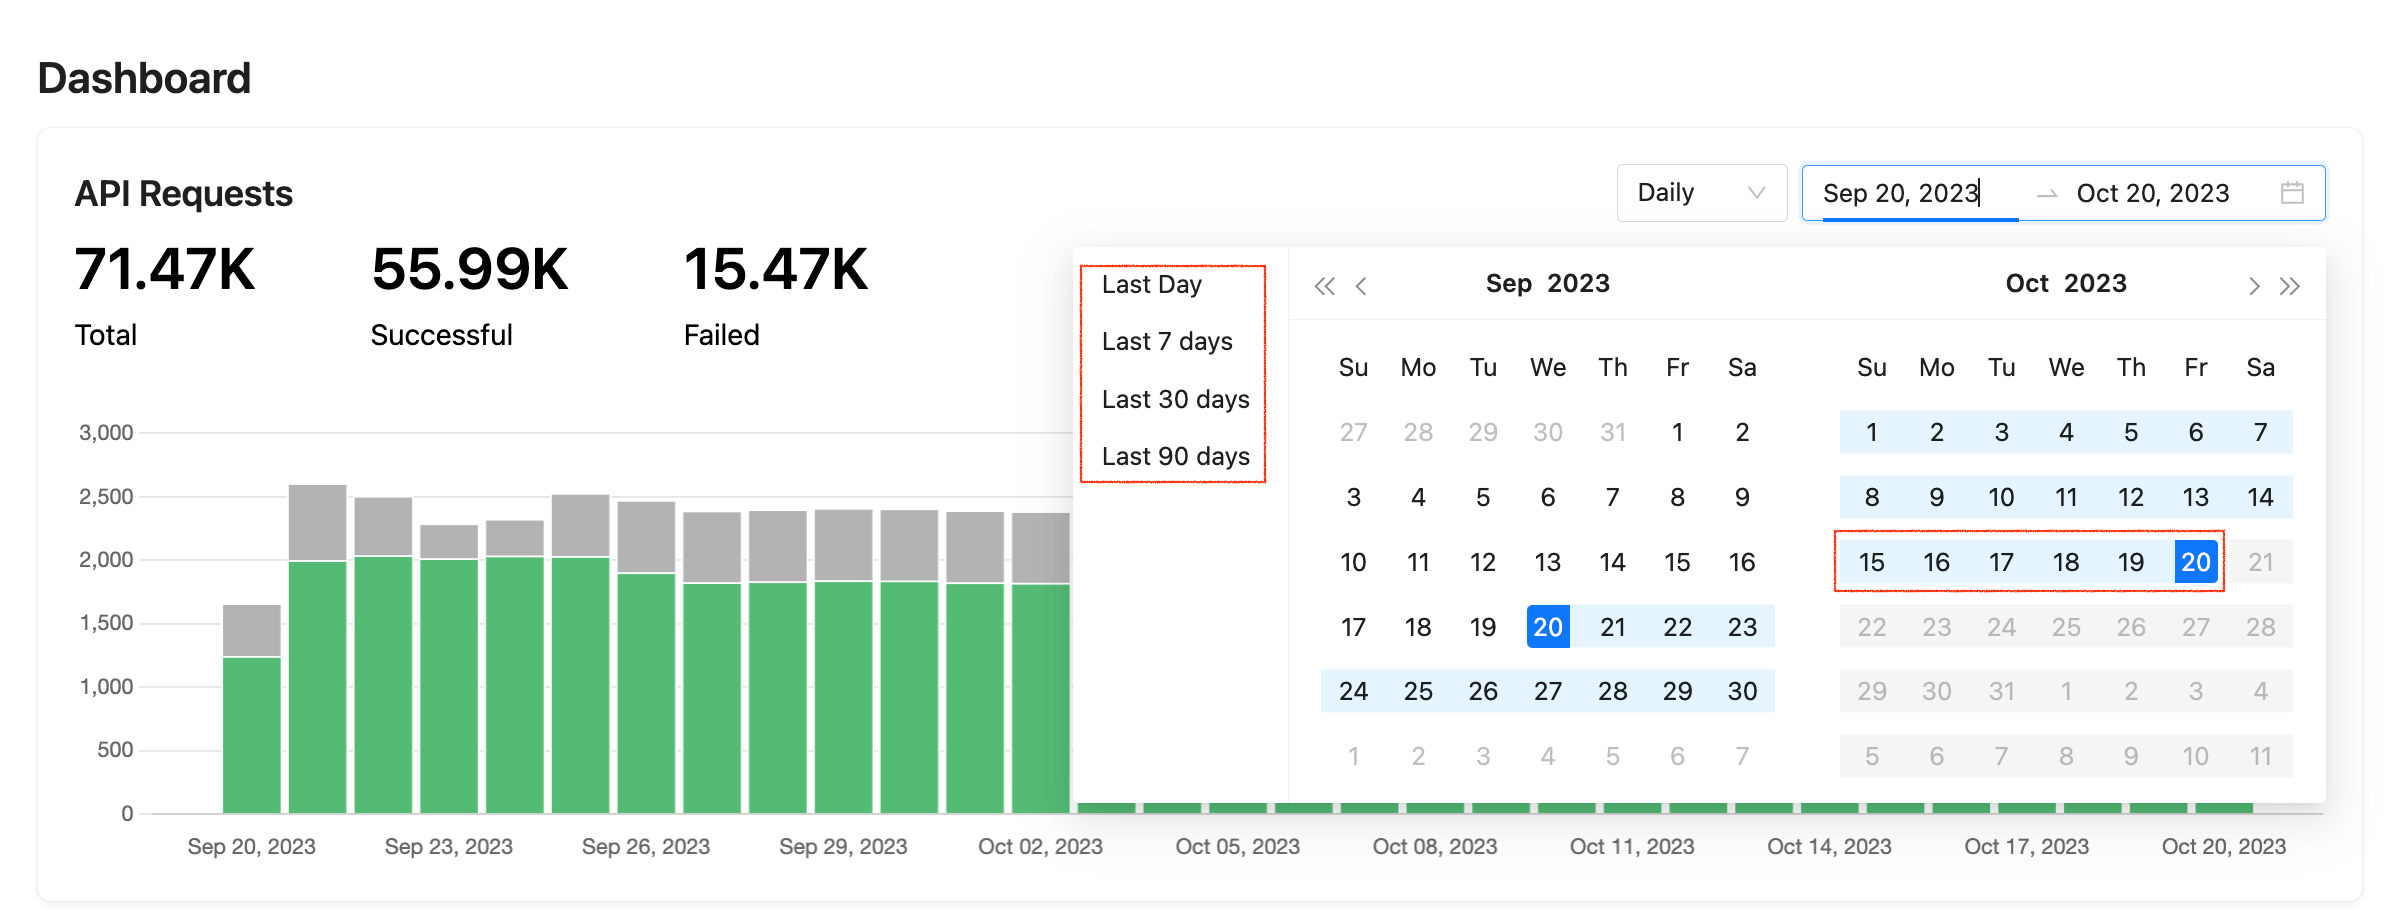
By default, the API requests period is selected as 1 month from the current date. You can also select a custom range – last day, 7 days, 90 days, or any desirable date range from the calendar view.

Dashboard date range history

The graph table view shows:

  • Total number of API requests to StackOne's Unified API

  • 🟒 Successful count, HTTP response code 200 or 201 (200s)

  • πŸ”΄ Failed count, any request which returned an error status code (400s or 500s)

You can review detailed information by hovering over individual bars in the chart. You can change the granularity of the data you're looking at via the relevant dropdown to view hourly, weekly or monthly data points.
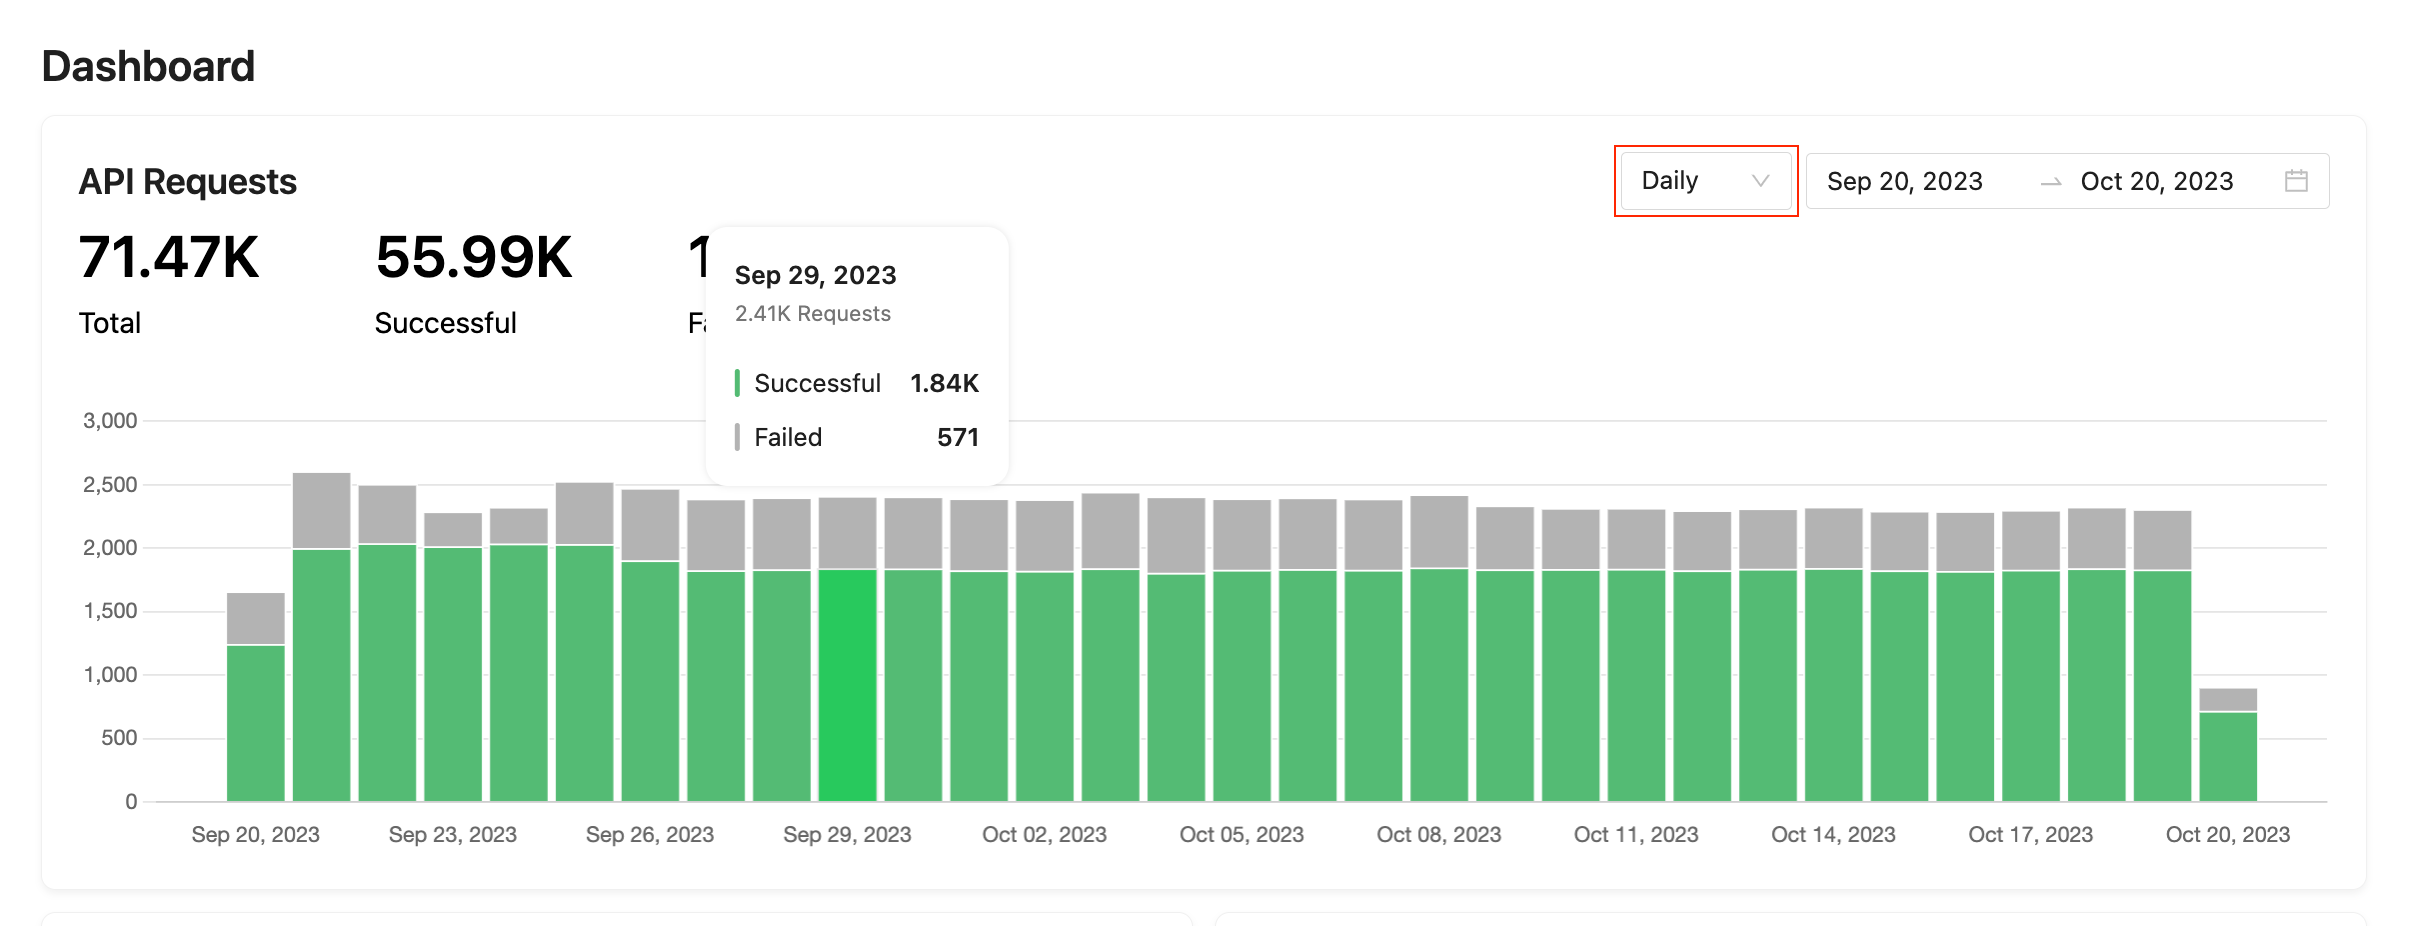
Dashboard time selector

πŸ“Š

Additional Info

The graph will count requests made to one of the supported unified API endpoint regardless of the source of the request as long as it was properly authenticated. This means requests made via Postman requests, the docs.stackone.com test UI, or any request made via the request tester in the accounts page will also be included within the graph.

Linked Accounts & Integrations

Linked Accounts shows the graph of active configured accounts in total. The graph and the delta number are for the last 7 days.

Integrations section beneath the main graph shows the list of all providers for which there is at least 1 linked account. Since you can enable or disable particular providers via the integrations page, the counter shows the In-Use/Enabled number.

Dashboard demo