

- Debugging issues with a particular account or integration
- Auditing the operations StackOne performs on your behalf
Request logs
When you execute an API query and want to investigate an API response, that’s when the realization comes – logs review is inevitable. The page shows all requests made to StackOne and also allows you to see all requests that StackOne made to the underlying providers to fulfill them. By default, it shows the logs in descending order per when the request occurred.Accessing the request logs page
After configuring Account integration and testing its connection, you can also access its specific request logs directly by clicking theView Logs option in the ellipsis menu.
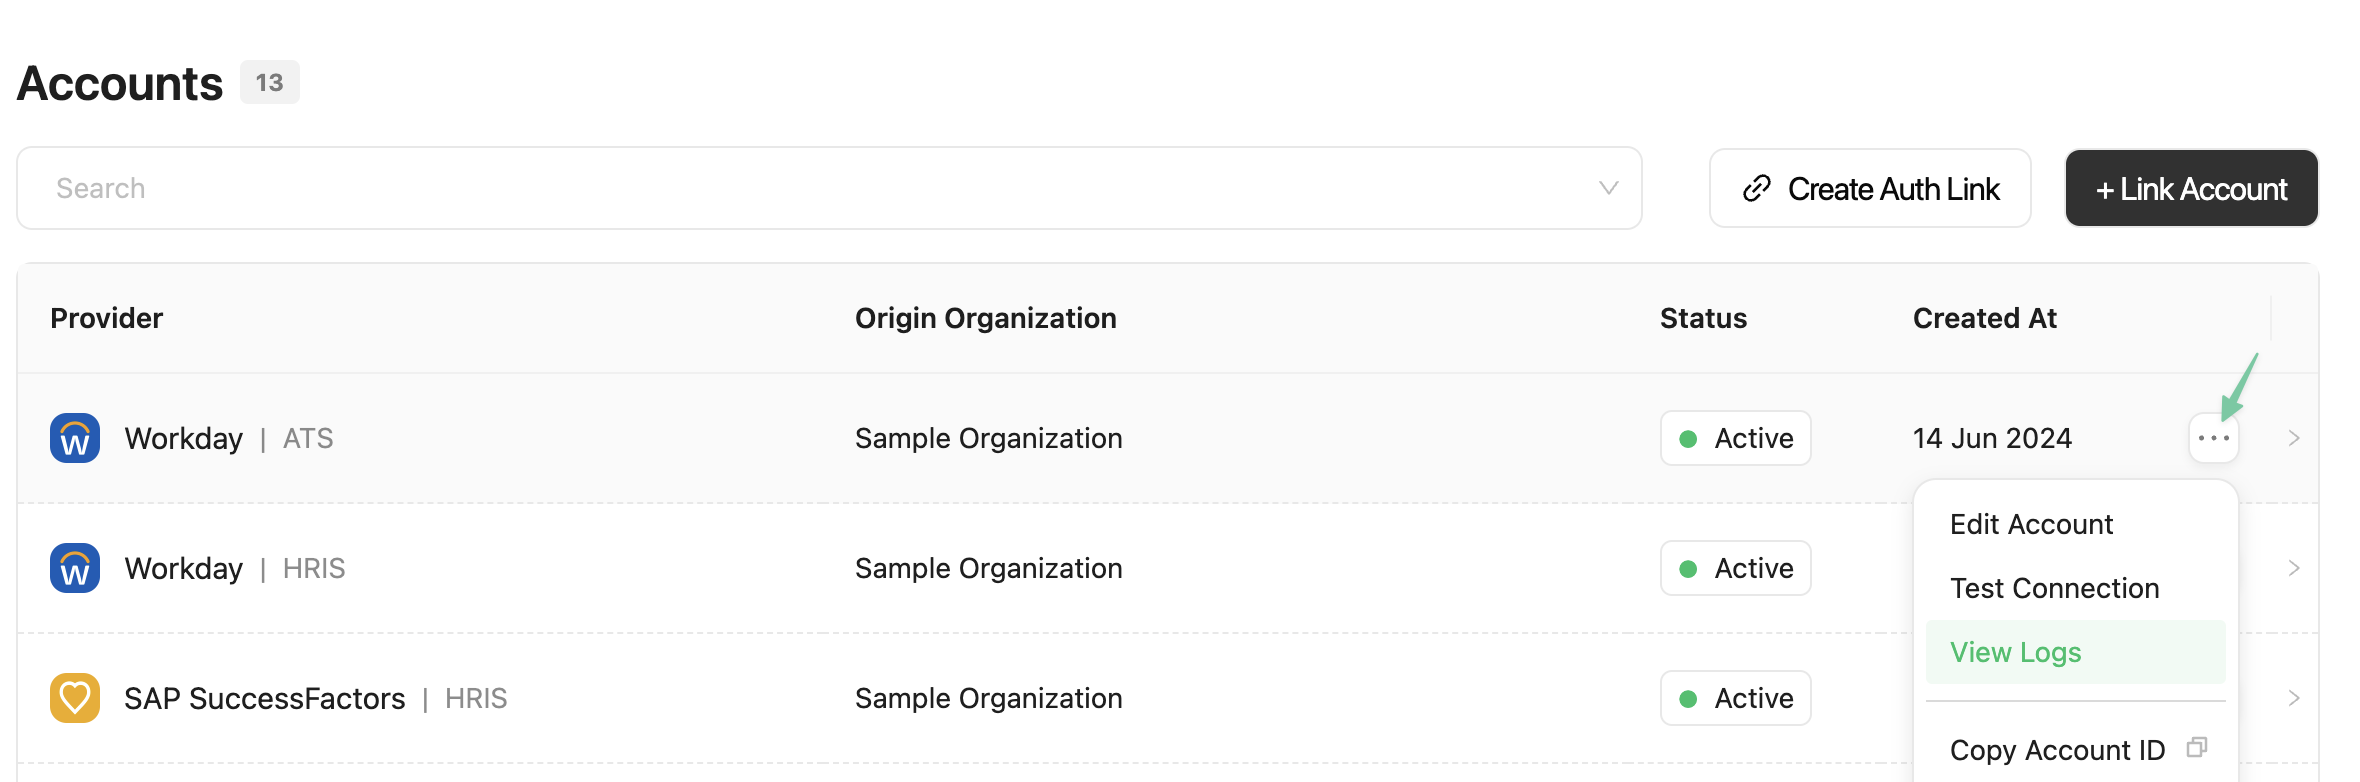
You will be redirected to the logs page with a filter pre-applied in the search bar
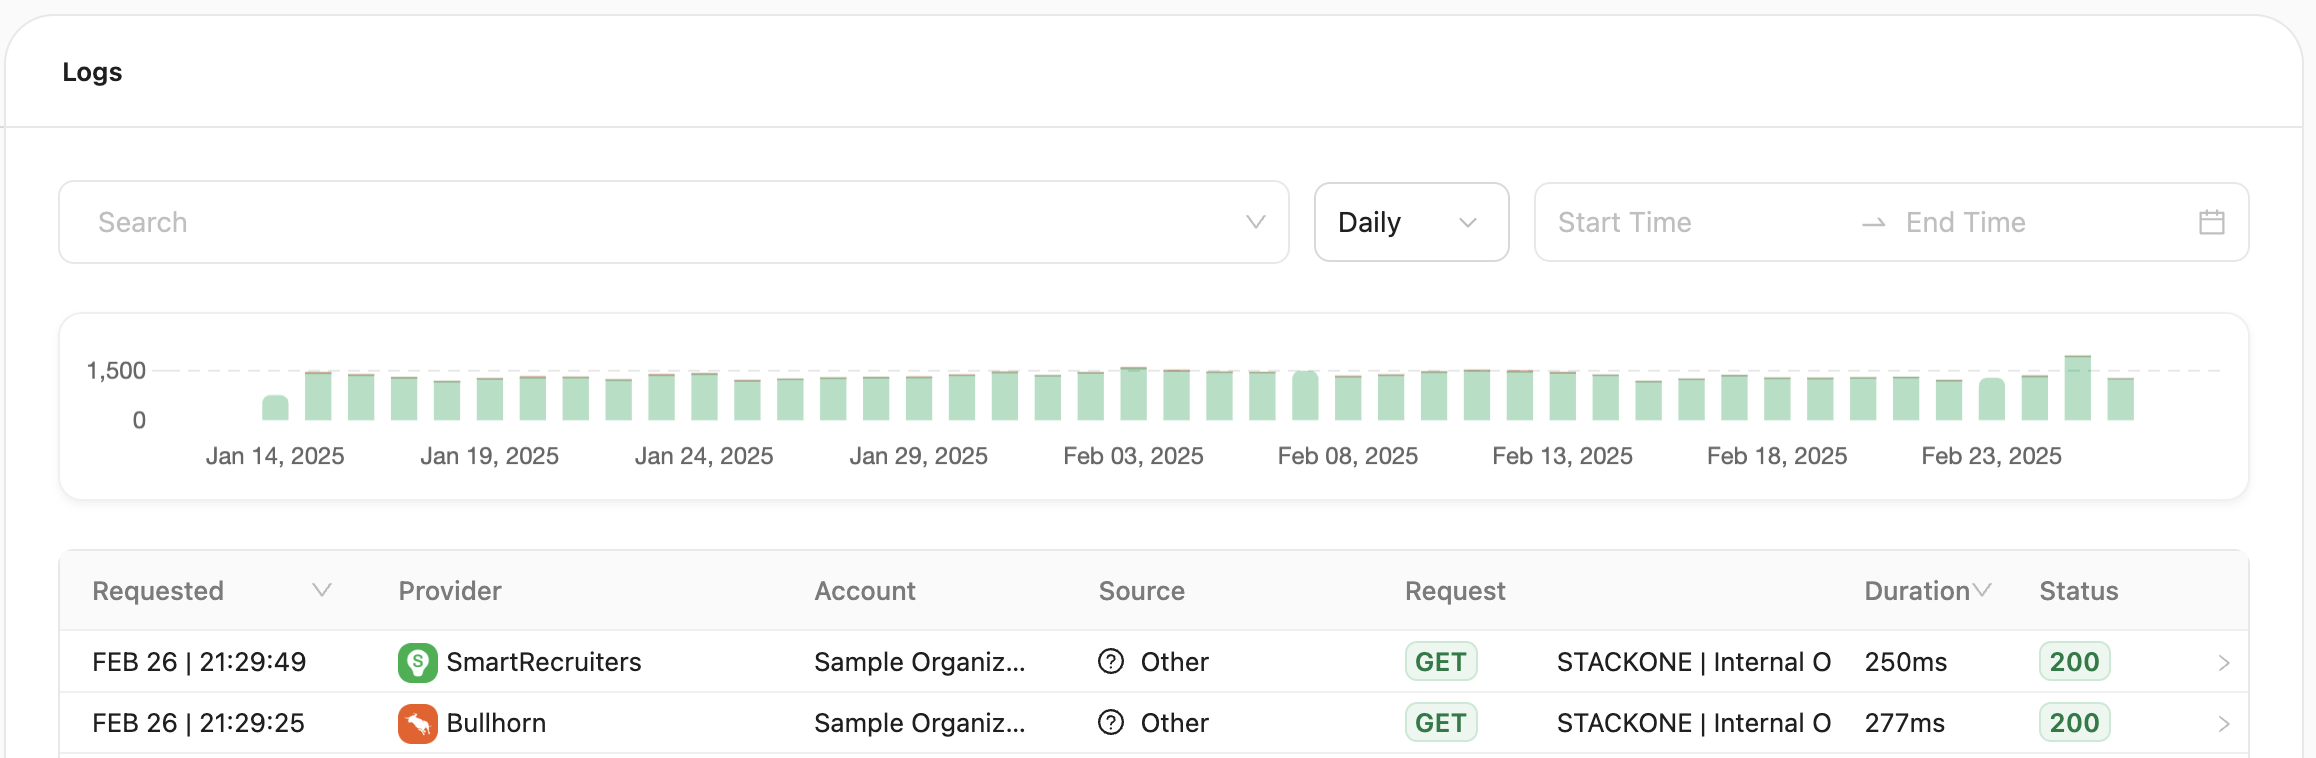
Filtering
All filters are grouped in a single search bar. Hover over it and click ❌ to remove multiple filters at once. The possible filtering options are:Viewing log details
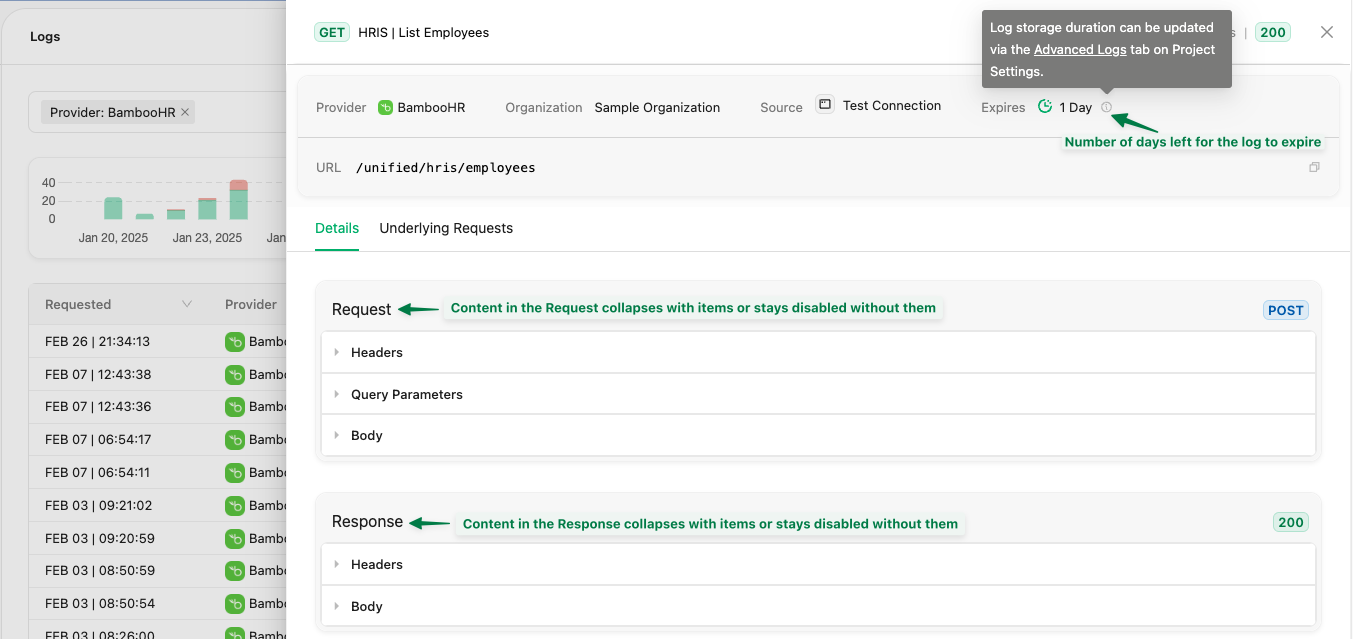
Click ➡️ on a log entry — including successful requests — to open a detailed view with two tabs:-
Details: Shows the details of the request made to StackOne, including request/response headers, body, query parameters, and status.
Note: Log storage duration can be configured in the Advanced Logs section of your Project Settings.
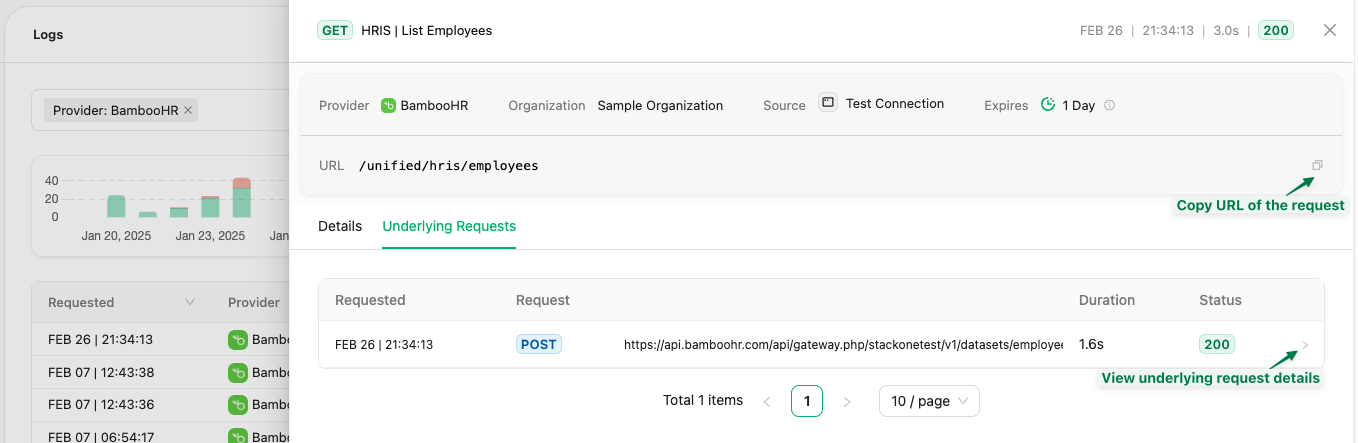
- Underlying Requests: Displays all API calls made to the provider’s API to fulfill your unified request to enable better debugging.
Programmatic access via API
You can also access request logs programmatically using the Logs API endpoints. For debugging failed calls, see Request Log Debugging. These APIs allow you to integrate log data into your monitoring, alerting, or analytics systems.Error Explainer
The Error Explainer is a built-in AI feature that helps you resolve errors without decoding raw logs or cryptic provider messages.How it works
How it works
Think of the Error Explainer as a smart resolution agent:
- Extracts key information from error logs automatically. No reading through raw JSON or HTTP dumps.
- Looks up context from multiple sources: provider documentation, StackOne documentation, and StackOne’s error guides.
- Generates resolution steps specific to your integration and the problem at hand. Expect three clear, actionable steps, prioritizing provider-specific errors as the root cause (e.g. “Refresh your access token with the correct scope”, or “Verify that the API key has permissions to call this endpoint”).
- Provider request logs: run it across all underlying requests to identify and fix broken ones
- Individual requests: generate tailored suggestions for a single error
- Account status page: if an account has connection issues, run it directly from the account’s page
The Error Explainer can be enabled or disabled per project under Project Settings → AI Settings, individually or via the global AI toggle. It also needs Advanced Logs enabled to have request detail to work from.
Connection issues behind a firewall
If a provider API or webhook endpoint is behind a firewall, allow inbound traffic from these StackOne IP addresses:
Requests from your infrastructure to the StackOne API may pass through AWS edge locations. If your firewall restricts outbound traffic, allow HTTPS traffic to the AWS edge location ranges and the StackOne IP addresses above.
StackOne may add or remove IP addresses when regions or infrastructure change. Check this list when updating your firewall rules. Requests from StackOne use HTTPS with TLS 1.2 or later.
Systems only reachable over your VPN or inside your VPC
Systems only reachable over your VPN or inside your VPC
StackOne calls providers and remote MCP servers over the public internet, so it needs a public HTTPS address for the system. A private address such as
10.0.4.12 or metabase.internal can’t be reached. With either setup below, StackOne can reach only the one service you publish, not the rest of your network. Either of these setups works today:- Publish one endpoint behind your firewall. Put the system’s API behind your existing reverse proxy, API gateway, or web application firewall, and allow only the StackOne IP addresses above.
- Run an outbound tunnel. Run a tunnel client such as Cloudflare Tunnel or ngrok on a host inside your network. It only makes outbound connections and gives you a public HTTPS URL that forwards to one internal service. Restrict that URL to the StackOne IP addresses above.
- A connector that asks for your instance URL, such as a self-hosted Grafana or OpenSearch. Enter the public URL when linking the account.
- Your own MCP server, if MCP connectors are enabled for your organization. Enter the public URL as the Remote MCP Server URL when adding the MCP connector.