> ## Documentation Index
> Fetch the complete documentation index at: https://docs.stackone.com/llms.txt
> Use this file to discover all available pages before exploring further.
# Troubleshooting
> Monitor and troubleshoot API requests with StackOne's request logs. View detailed information about API calls, filter by various parameters, and analyze both the requests you make to StackOne and the underlying provider interactions.
StackOne registers relevant information of requests made to the connected provider to fulfill any request it receives. This can be useful for:
* Debugging issues with a particular account or integration
* Auditing the operations StackOne performs on your behalf
The [Request Logs](https://app.stackone.com/request_logs) page offers efficient find, filter, and analysis of API requests and HTTP status codes.
Logs are only persisted up to 90 days after the original request occurred.
## Request logs
When you execute an API query and want to investigate an API response, that's when the realization comes – logs review is inevitable.
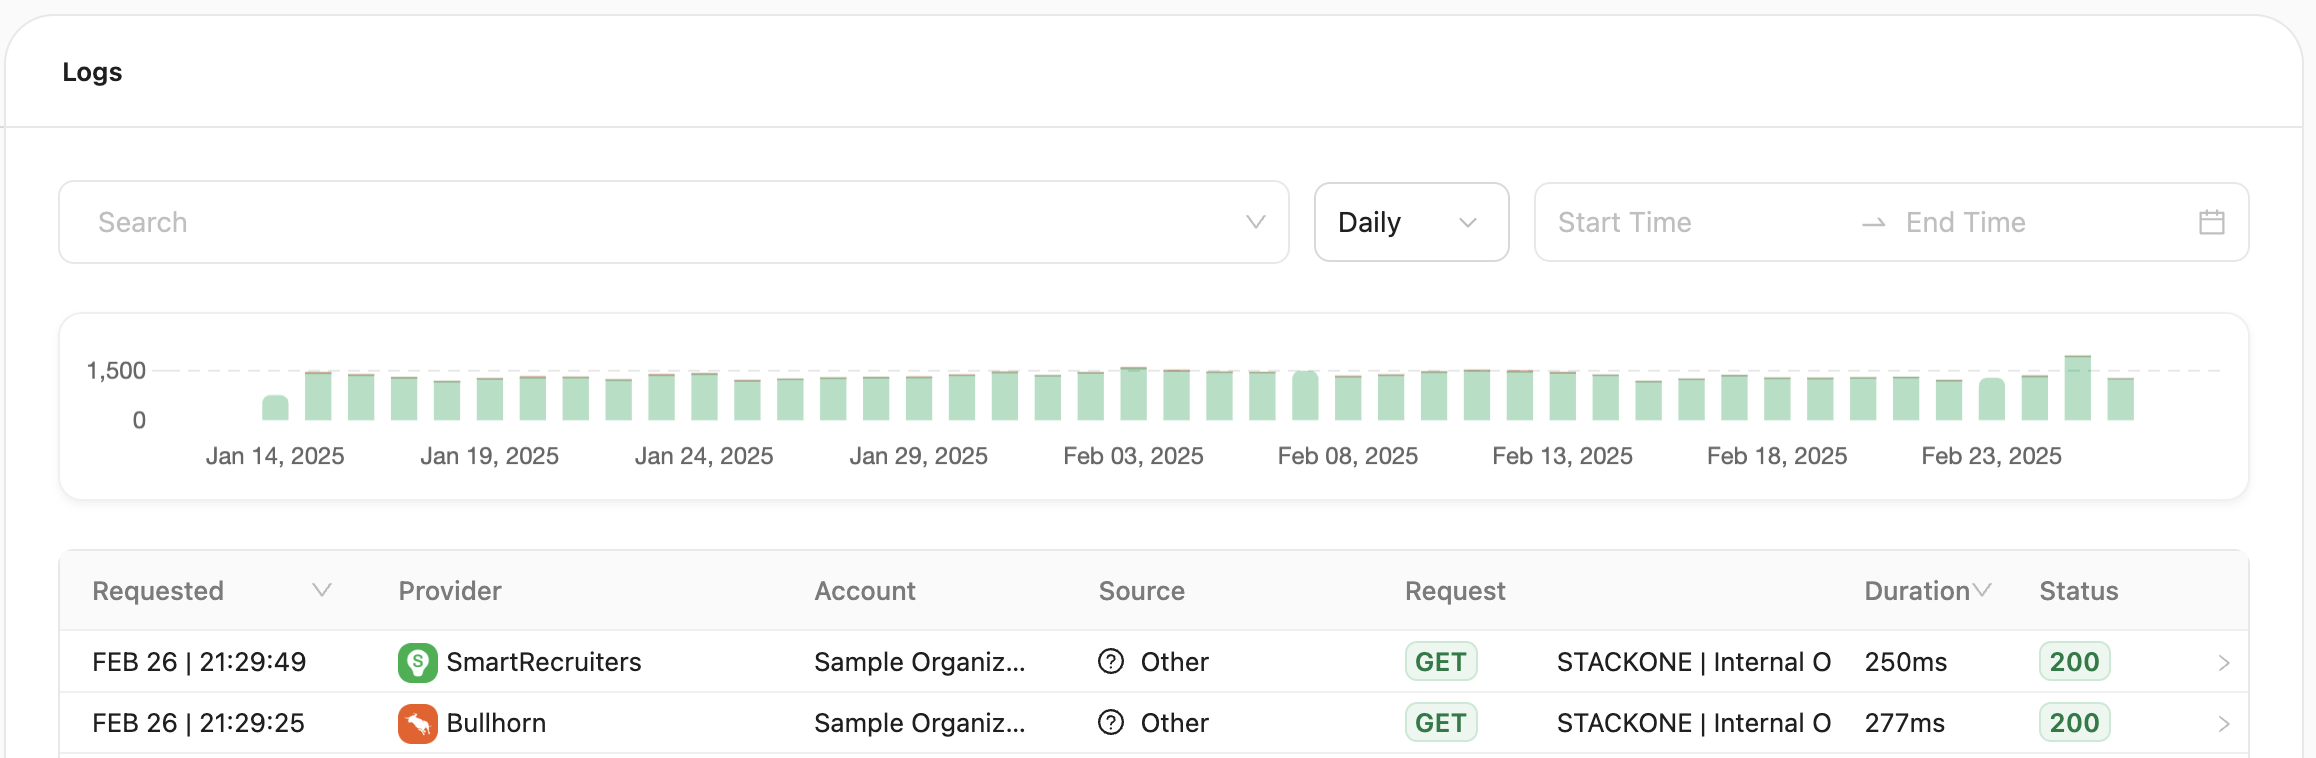
The page shows all requests made to StackOne and also allows you to see all requests that StackOne made to the [underlying providers](https://www.stackone.com/integrations) to fulfill them. By default, it shows the logs in descending order per when the request occurred.
### Accessing the request logs page
After configuring Account integration and testing its connection, you can also access its specific request logs directly by clicking the `View Logs` option in the ellipsis menu.
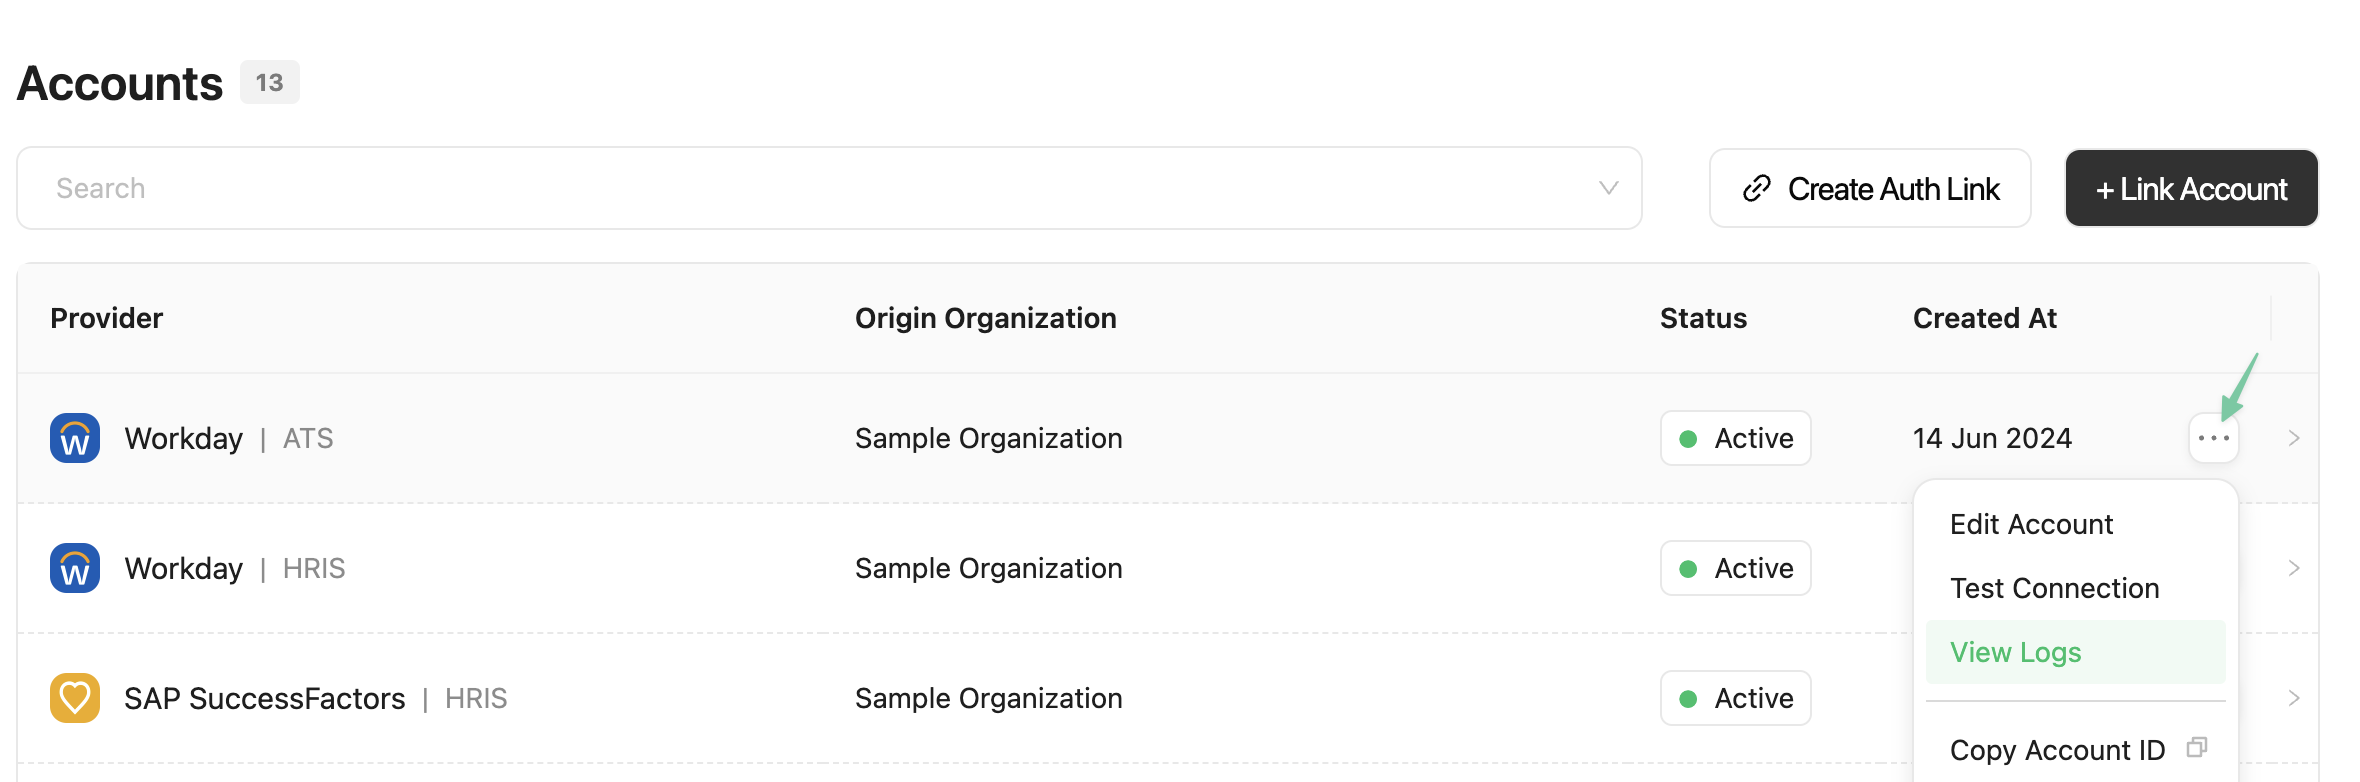
You will be redirected to the logs page with a filter pre-applied in the search bar
 ### Filtering
All filters are grouped in a single search bar — hover over it and click ❌ to remove multiple filters at once. The possible filtering options are:
| Filter | Description | Example values |
| :------------------ | :---------------------------------------------------------------------------------------------------------------------------------------------------------------------------------------------------------------------------------------- | :---------------------------------------------------------------------------------------- |
| Account | The linked accounts' `origin_owner_name` for the current project. You can also see & search within that filter for a specific provider in case multiple accounts have been linked for the same `origin_owner_name` | `Acme Inc.` `Sample Organization` |
| Provider | The specific [connector](/connectors/introduction) associated with the request | `Workday``Ashby``Salesforce` |
| Resource | The type of resource (and optionally sub resource requested and the action done on the resource. | `List Employees``Create Candidates Note``Get Applications Offer` |
| Source | The source that originated the request - specifically the type of source allowing you to filter for requests made via the StackOne U.I. or an API key | `API Request` `Dashboard UI` `Webhook` `Test Connection` `Other` (e.g. Postman, API docs) |
| Status | The response's [HTTP status code](https://developer.mozilla.org/en-US/docs/Web/HTTP/Status) - refer to additional documentation here regarding the meaning behind the [error codes](/legacy-unified-apis/error-codes-and-troubleshooting) | `200` `201` `400` `404` `502` |
| Method | The HTTP method used to make the request | `post``get``patch` |
| Start/End date time | A date and time window | `Jan 01, 2023 01:01` |
### Viewing log details
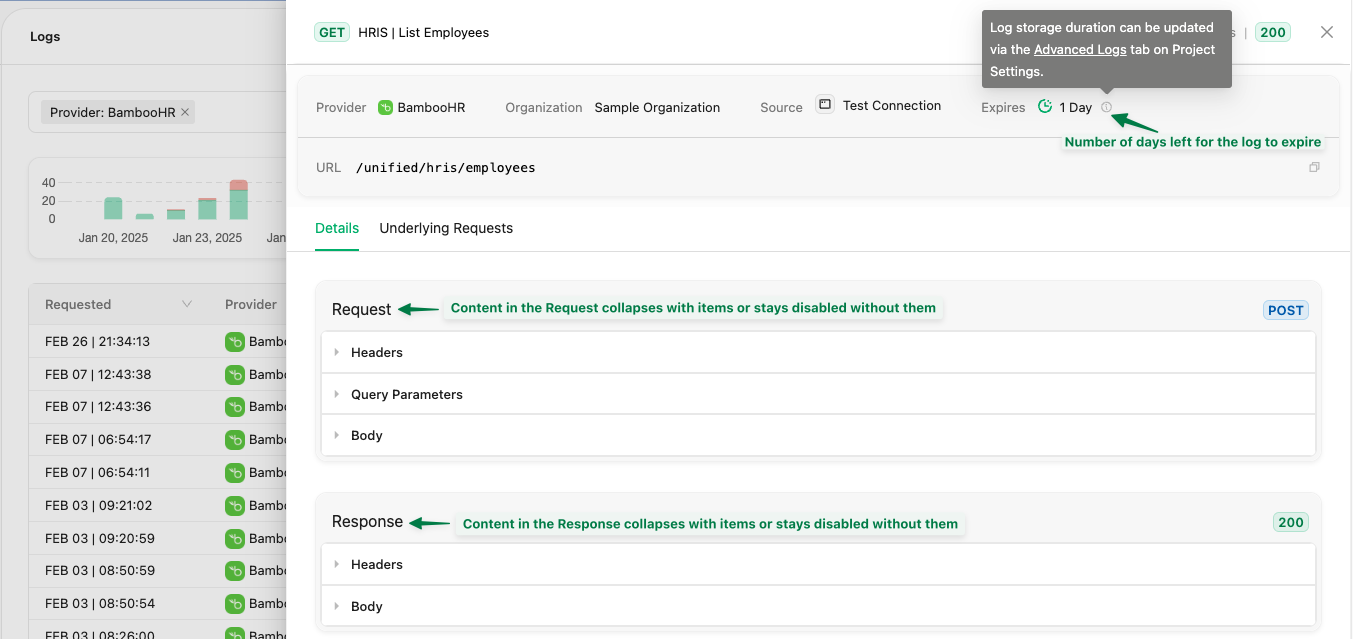
Click ➡️ on a log entry — including successful requests — to open a detailed view with two tabs:
1. **Details**: Shows the details of the request made to StackOne, including request/response headers, body, query parameters, and status.
> Note: Log storage duration can be configured in the [Advanced Logs](/secure/observability#advanced-logs) section of your Project Settings.
### Filtering
All filters are grouped in a single search bar — hover over it and click ❌ to remove multiple filters at once. The possible filtering options are:
| Filter | Description | Example values |
| :------------------ | :---------------------------------------------------------------------------------------------------------------------------------------------------------------------------------------------------------------------------------------- | :---------------------------------------------------------------------------------------- |
| Account | The linked accounts' `origin_owner_name` for the current project. You can also see & search within that filter for a specific provider in case multiple accounts have been linked for the same `origin_owner_name` | `Acme Inc.` `Sample Organization` |
| Provider | The specific [connector](/connectors/introduction) associated with the request | `Workday``Ashby``Salesforce` |
| Resource | The type of resource (and optionally sub resource requested and the action done on the resource. | `List Employees``Create Candidates Note``Get Applications Offer` |
| Source | The source that originated the request - specifically the type of source allowing you to filter for requests made via the StackOne U.I. or an API key | `API Request` `Dashboard UI` `Webhook` `Test Connection` `Other` (e.g. Postman, API docs) |
| Status | The response's [HTTP status code](https://developer.mozilla.org/en-US/docs/Web/HTTP/Status) - refer to additional documentation here regarding the meaning behind the [error codes](/legacy-unified-apis/error-codes-and-troubleshooting) | `200` `201` `400` `404` `502` |
| Method | The HTTP method used to make the request | `post``get``patch` |
| Start/End date time | A date and time window | `Jan 01, 2023 01:01` |
### Viewing log details
Click ➡️ on a log entry — including successful requests — to open a detailed view with two tabs:
1. **Details**: Shows the details of the request made to StackOne, including request/response headers, body, query parameters, and status.
> Note: Log storage duration can be configured in the [Advanced Logs](/secure/observability#advanced-logs) section of your Project Settings.
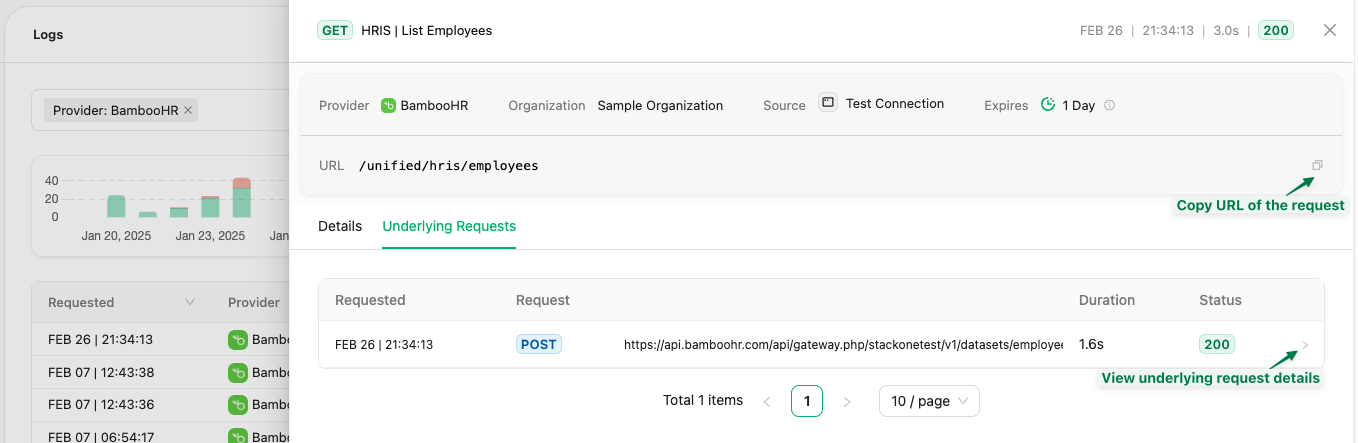
 2. **Underlying Requests**: Displays all API calls made to the provider's API to fulfill your unified request to enable better debugging.
 ### Programmatic access via API
You can also access request logs programmatically using the Logs API endpoints. For debugging failed calls, see [Request Log Debugging](/features/observability/request-log-debugging).
These APIs allow you to integrate log data into your monitoring, alerting, or analytics systems.
***
## Error Explainer
The **Error Explainer** is a built-in AI feature that helps you resolve errors without decoding raw logs or cryptic provider messages.
Think of the Error Explainer as a smart resolution agent:
* **Extracts key information** from error logs automatically — no reading through raw JSON or HTTP dumps.
* **Looks up context** from multiple sources: provider documentation, StackOne documentation, and StackOne's error guides.
* **Generates resolution steps** specific to your integration and the problem at hand — typically three clear, actionable steps, prioritizing provider-specific errors as the root cause (e.g. "Refresh your access token with the correct scope", or "Verify that the API key has permissions to call this endpoint").
```mermaid theme={null}
flowchart TD
A[Connection Error] -->|Click to Generate| B(Extract Error Information)
B --> C{Resolve Error}
C --> D[Check Error Codes]
C --> E[Search StackOne Docs]
C --> F[Search Provider Docs]
D --> G[Generate Resolution Steps]
E --> G
F --> G
```
Invoke it by clicking **Click to Generate** wherever it appears, in three places:
* **Provider request logs** — run it across all underlying requests to identify and fix broken ones
* **Individual requests** — generate tailored suggestions for a single error
* **Account status page** — if an account has connection issues, run it directly from the account's page
The Error Explainer can be enabled or disabled per project under **Project Settings → AI Settings**, individually or via the global AI toggle. It also needs [Advanced Logs](/secure/observability#advanced-logs) enabled to have request detail to work from.
Your logs are only used to generate explanations for your own account — no PII is used in training or evaluation. Each explanation can be rated in the dashboard, on both usefulness and the accuracy of its suggested steps.
### Programmatic access via API
You can also access request logs programmatically using the Logs API endpoints. For debugging failed calls, see [Request Log Debugging](/features/observability/request-log-debugging).
These APIs allow you to integrate log data into your monitoring, alerting, or analytics systems.
***
## Error Explainer
The **Error Explainer** is a built-in AI feature that helps you resolve errors without decoding raw logs or cryptic provider messages.
Think of the Error Explainer as a smart resolution agent:
* **Extracts key information** from error logs automatically — no reading through raw JSON or HTTP dumps.
* **Looks up context** from multiple sources: provider documentation, StackOne documentation, and StackOne's error guides.
* **Generates resolution steps** specific to your integration and the problem at hand — typically three clear, actionable steps, prioritizing provider-specific errors as the root cause (e.g. "Refresh your access token with the correct scope", or "Verify that the API key has permissions to call this endpoint").
```mermaid theme={null}
flowchart TD
A[Connection Error] -->|Click to Generate| B(Extract Error Information)
B --> C{Resolve Error}
C --> D[Check Error Codes]
C --> E[Search StackOne Docs]
C --> F[Search Provider Docs]
D --> G[Generate Resolution Steps]
E --> G
F --> G
```
Invoke it by clicking **Click to Generate** wherever it appears, in three places:
* **Provider request logs** — run it across all underlying requests to identify and fix broken ones
* **Individual requests** — generate tailored suggestions for a single error
* **Account status page** — if an account has connection issues, run it directly from the account's page
The Error Explainer can be enabled or disabled per project under **Project Settings → AI Settings**, individually or via the global AI toggle. It also needs [Advanced Logs](/secure/observability#advanced-logs) enabled to have request detail to work from.
Your logs are only used to generate explanations for your own account — no PII is used in training or evaluation. Each explanation can be rated in the dashboard, on both usefulness and the accuracy of its suggested steps.